What if spatial data and media could be explored on a whiteboard?
Visualise your spatial data with filters and Choropleths
Convert your mindmaps into interactive data stories
When you share your story, your mindmap is shared alongside, contextualise to a new level
Some sample stories...
Please use a desktop to view these stories.

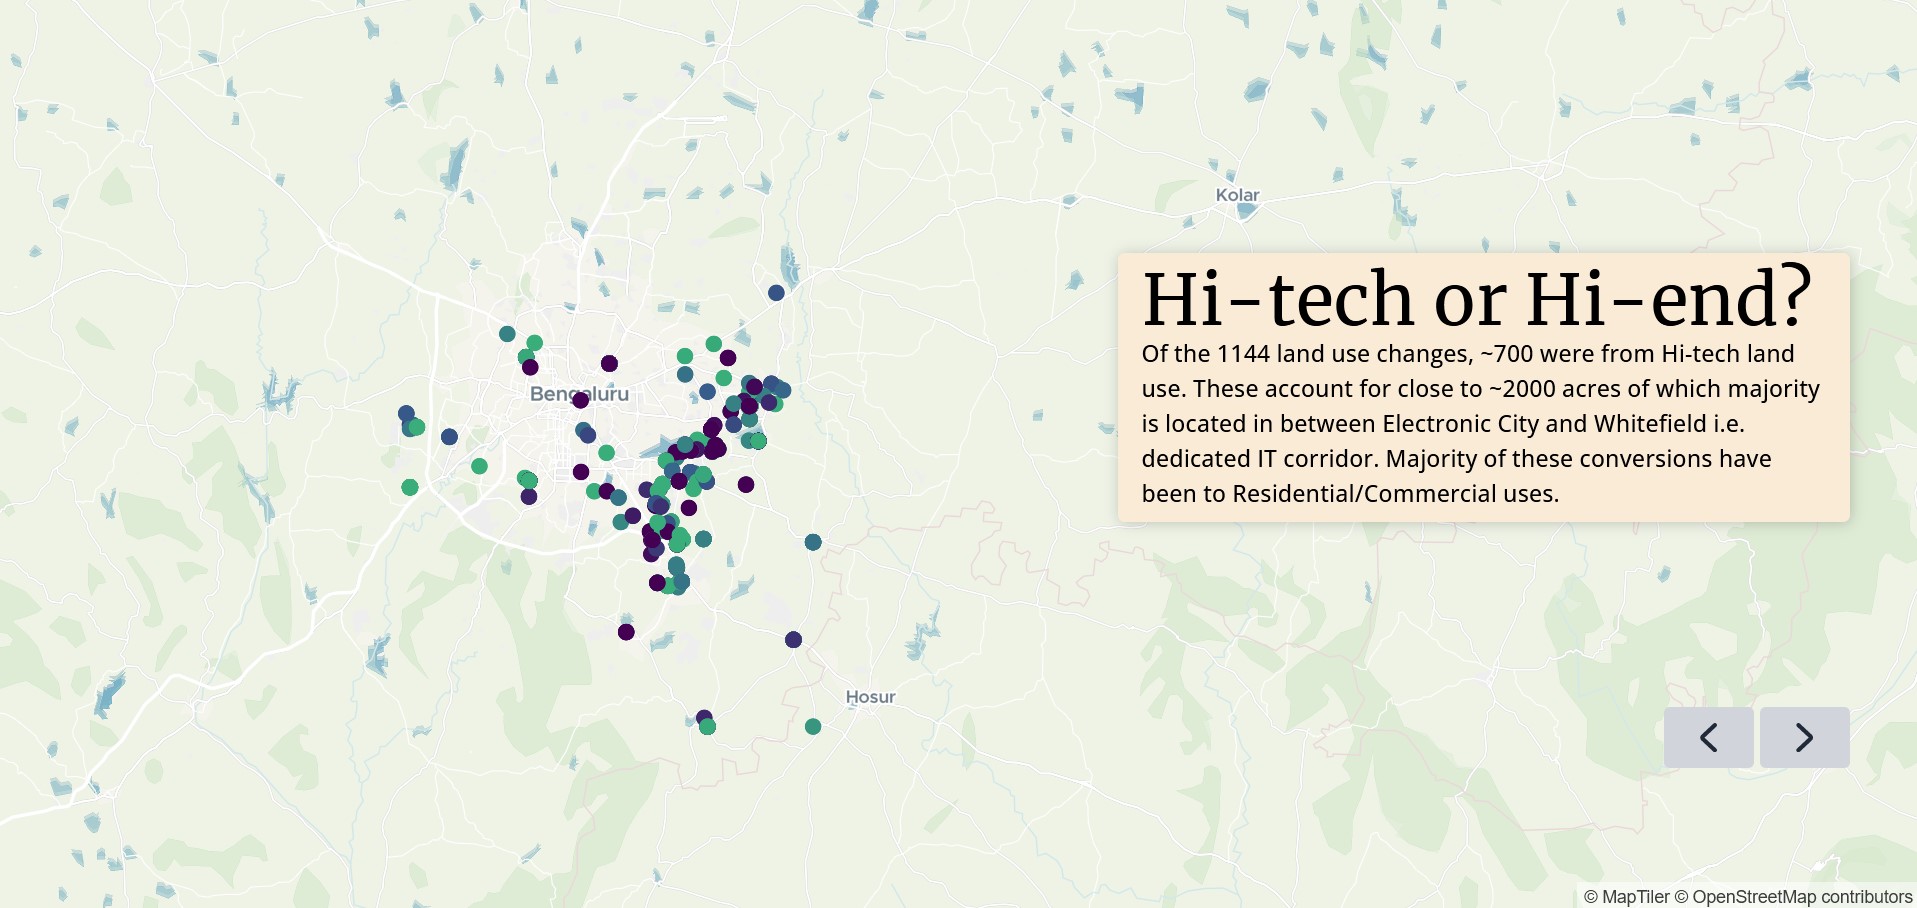
Bengaluru's Land-Use Change Trends
..., the data from 2007-2019 showcases how 'Hi-Tech' a land use introduced specially in the 2007 master plan to promote IT industries has become the new location for residential and commercial real estate in the city.

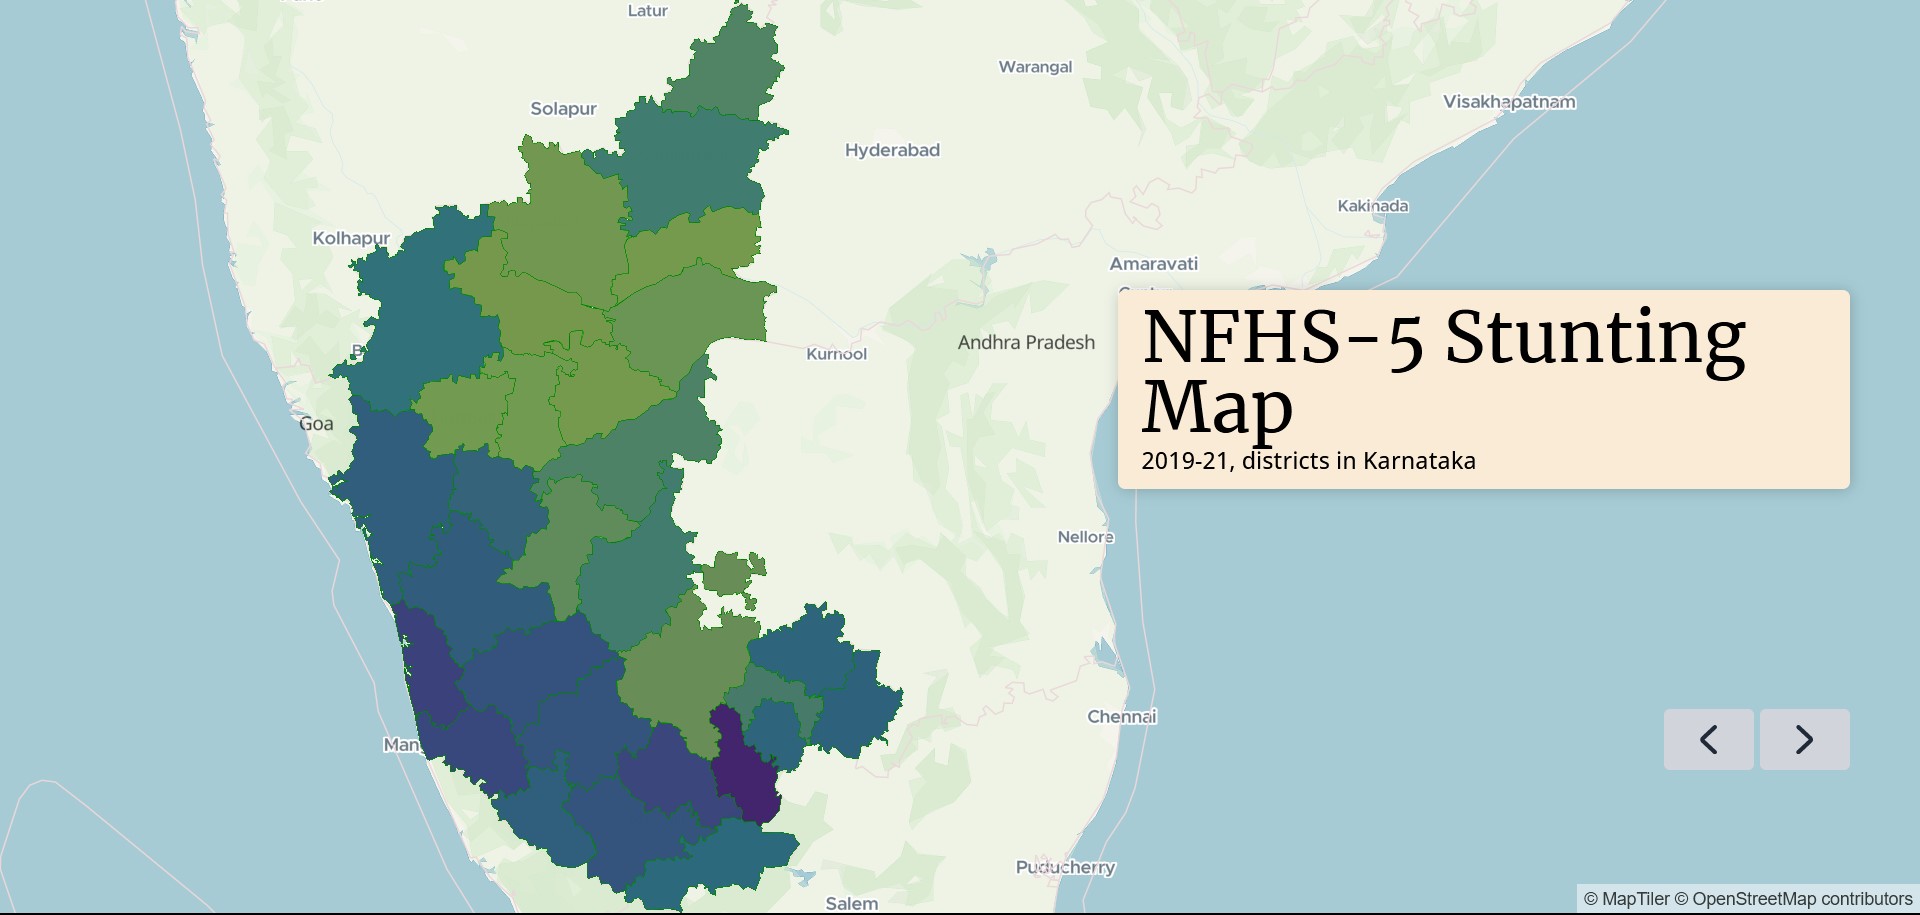
Geographical Patterns of Child Malnutrition in Karnataka
Even after making decades of progress, India is still home to a major fraction of the world's malnourished children. Malnutrition in early childhood is associated with lower cognitive and physical ability, and can have a lifelong impact...

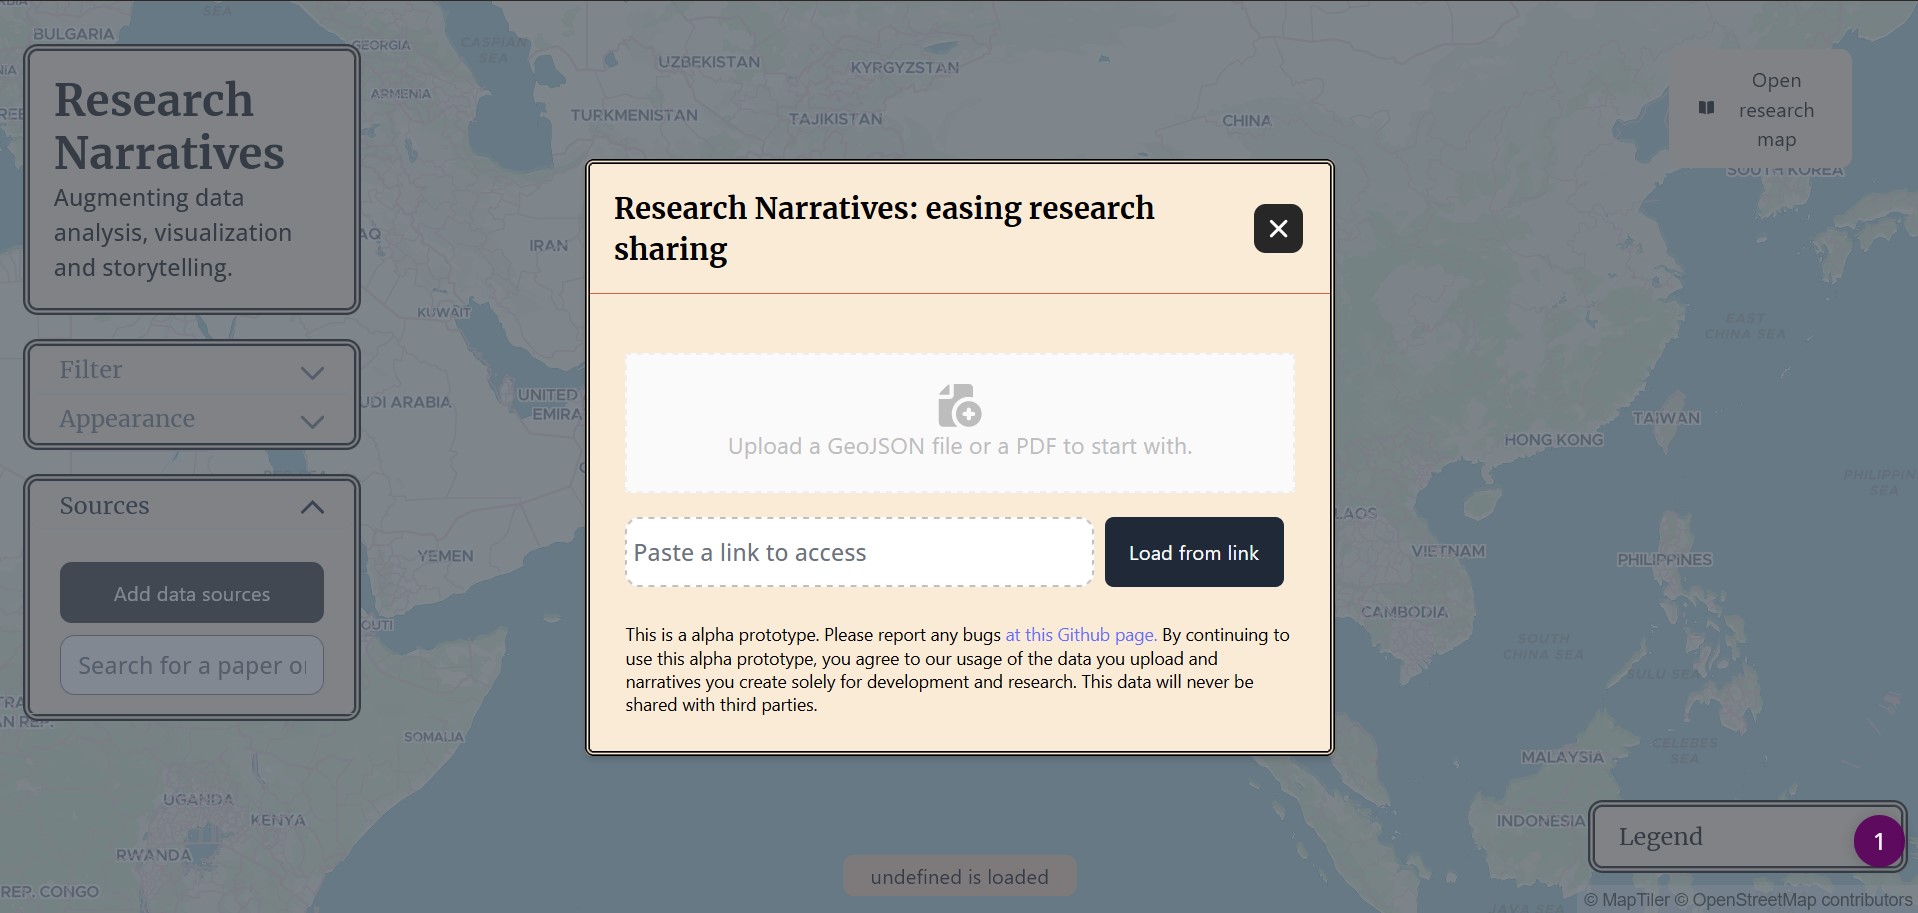
Try out the proof of concept
You can upload your own data and create your own stories. The tool is in its alpha stages, so please bear with us. We are looking for contributors to help us build this tool. If you are interested, please reach out to us at...